Credit Analytics is live in Scanifly. One credit is one dollar, credits roll over, and now you can see every one of them by project, product, and person.
Every week, our team talks to installers who can’t answer three easy questions about their design software: how much we’re paying, how many credits we have left, and who on the team is using them. And it’s entirely because their software vendor makes it hard to understand.
We’ve always handled credits simply, where one credit equals one dollar. They roll over, and they work across everything you order in Scanifly, from site models to plan sets to Nearmap imagery. What we didn’t have was a way for you to see all of that activity in one place without emailing your account manager for a spreadsheet.
Credit Analytics fixes that. Here’s what shipped, why we built it, and what to do with it.
Simply put, Credits shouldn’t make you scream.
What Credit Analytics shows you
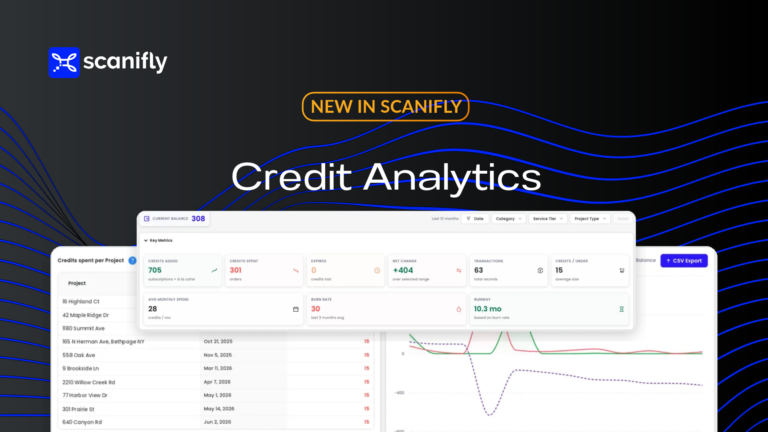
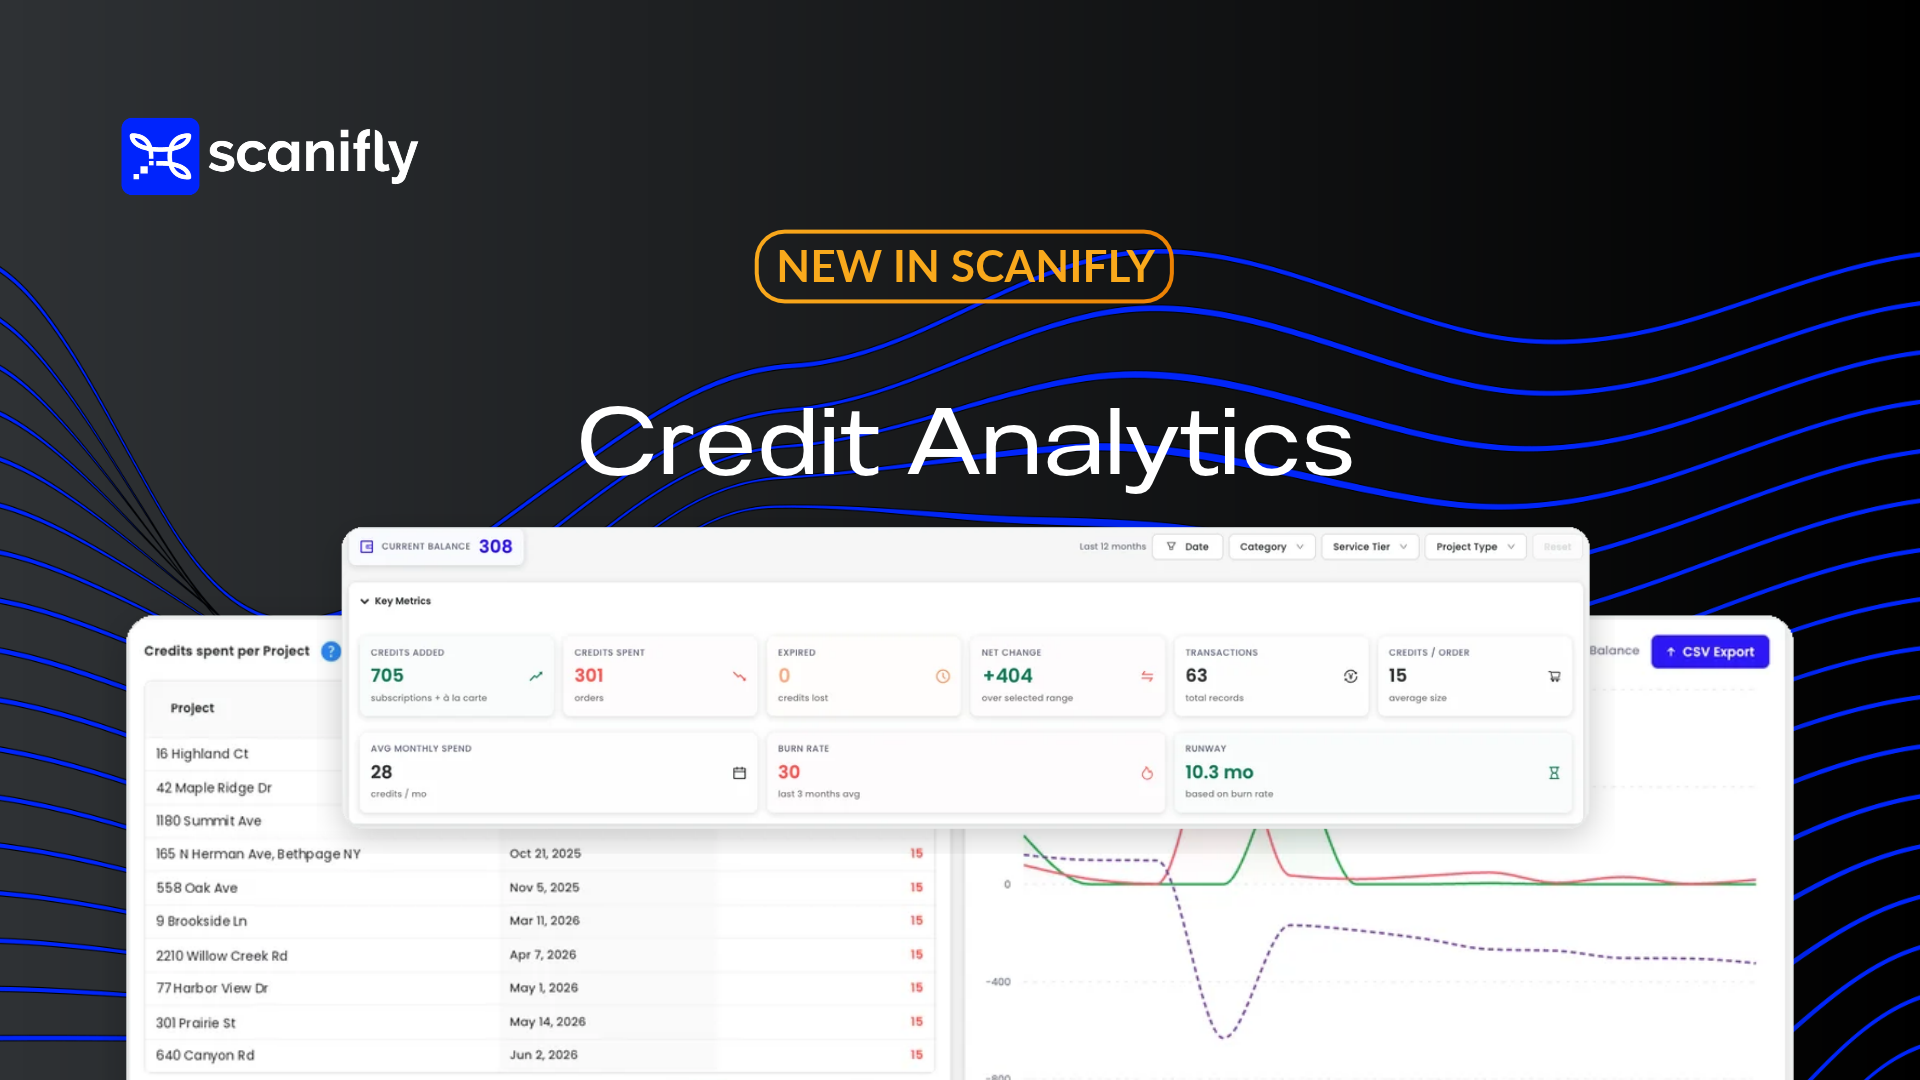
Click your credit balance in the bottom-left of the Scanifly portal, open your credit history, and hit Credit Analytics. Every credit your account has purchased or spent is laid out by project, by product, by user, and by month.
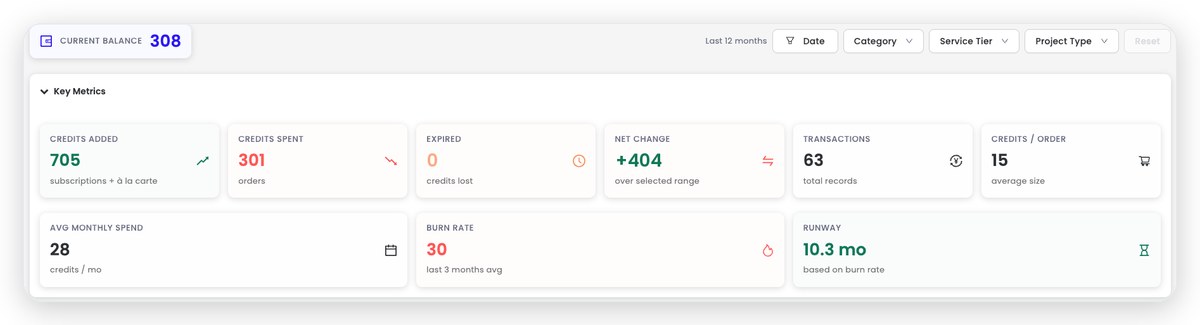
- Balance and key metrics up top. Your dashboard has credits added, credits spent, and average monthly spend.
- Spend by deliverable. View how many credits went to site modeling, wireframes, true-ups, plan sets, and Nearmap.
- Credits by user. Who on your team is ordering what. Good for coaching, better for budgeting.
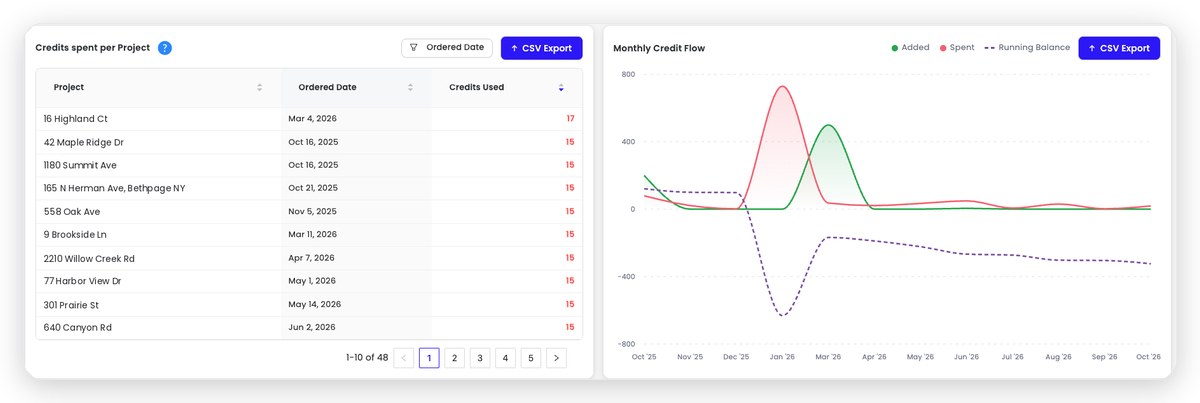
- Credits by project, with purchase dates. See what each job costs, and easily filter by date.
- Monthly credit flow. Added versus spent, month by month, with your running balance to track usage.
- A monthly pivot table with totals, plus CSV and PDF export for fast, easy reconciliation.
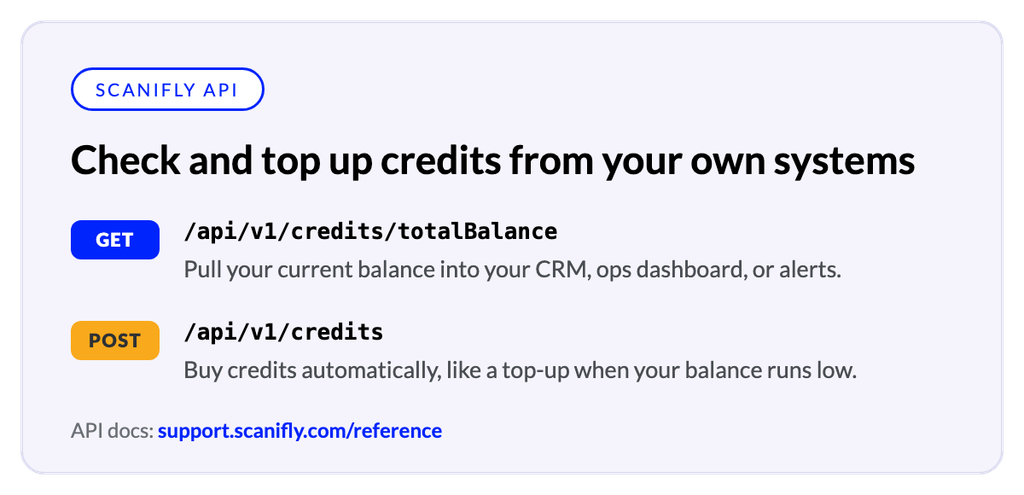
- Credits through the API. Pull your current balance into your CRM or ops dashboard, and buy credits programmatically, like an automatic top-up when your balance runs low.
Filters for date range, category, service tier, and project type sit in one row at the top to filter across all orders. The dashboard defaults to the last 12 months of work.
Why we built it this way
Several installers who switched to Scanifly from Aurora this summer told us some version of the same story. They couldn’t tell what they were paying, where the credits were going, or why unused credits disappeared at renewal. One of them was pasting their credit report into ChatGPT just to decode it. Another prepaid five figures in credits and used only a fraction before the rest expired.
Credits are your money. You should be able to see them the way you see any other line item in the business: by project, by product, by person, exportable, and without an expiration date hanging over you. So here’s where we stand, and where we’ll stay.
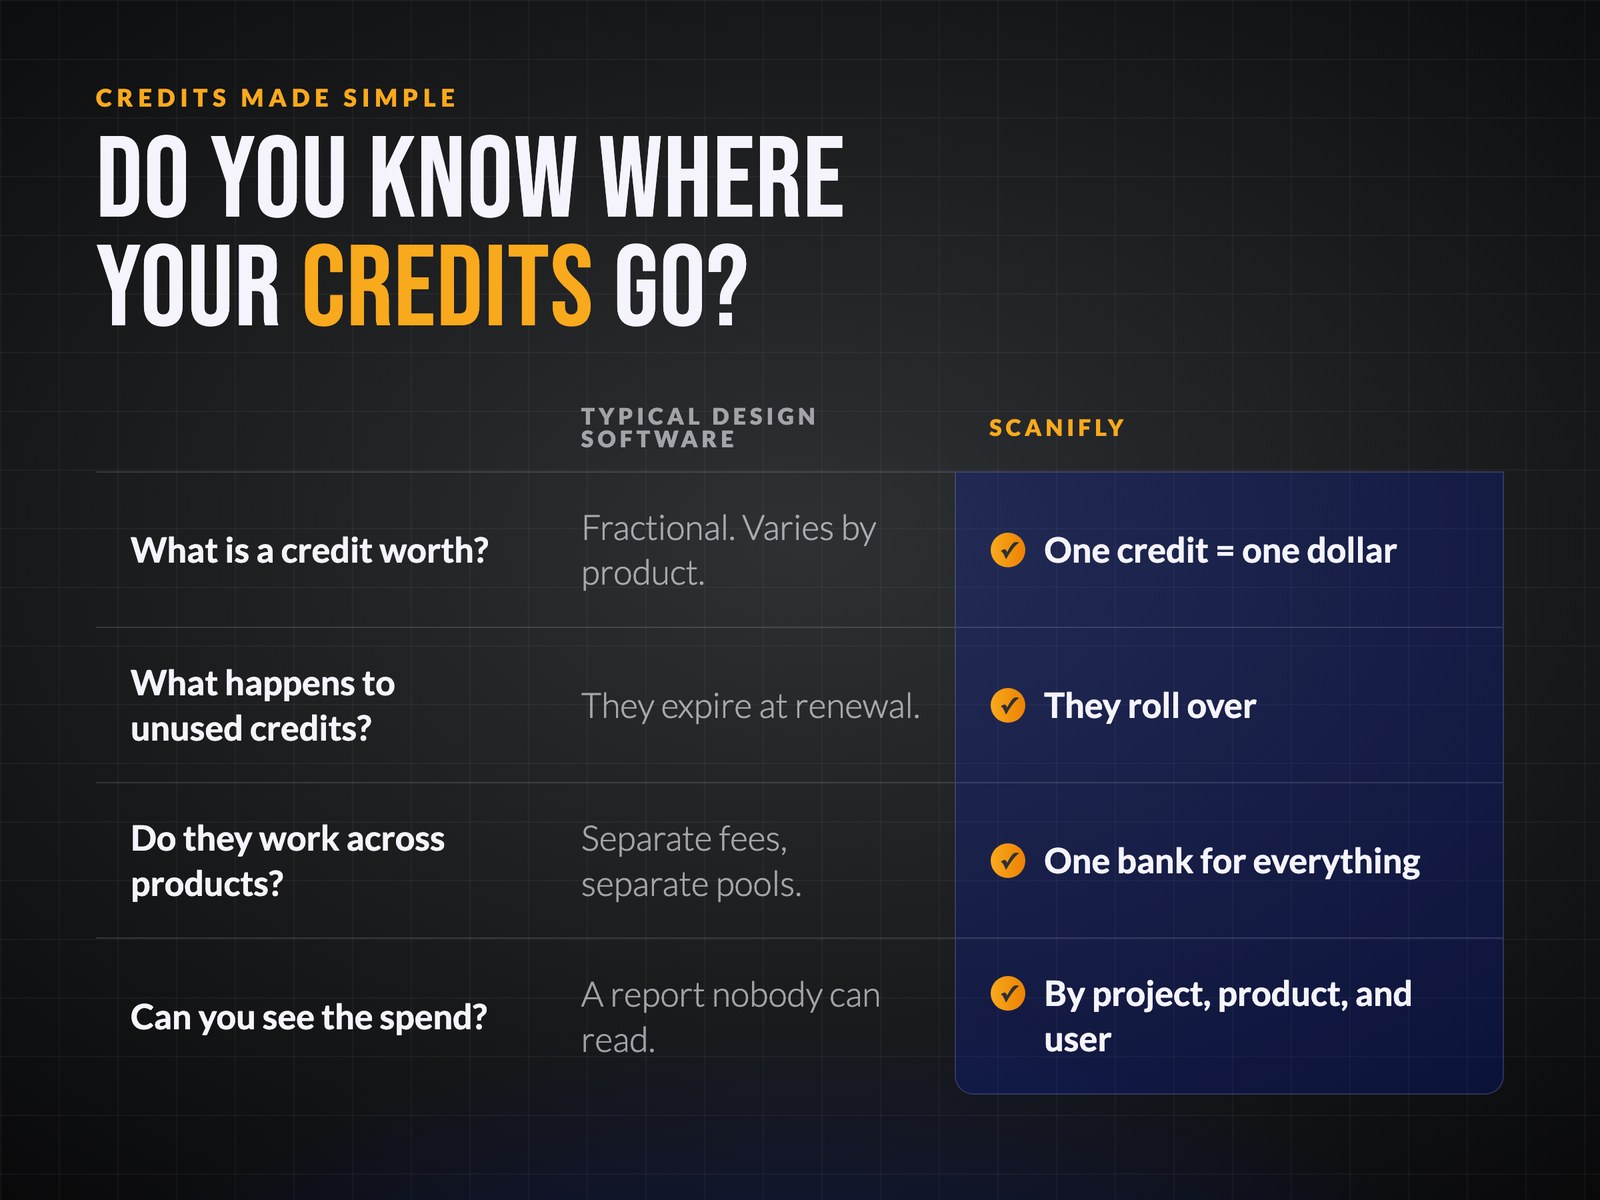
- One credit is one dollar. No fractional credits, no conversion table, no guessing what a design actually costs.
- Credits roll over. What you don’t use this term is still yours when you renew.
- One bank for everything. Site models, wireframes, plan sets, and Nearmap all pull from the same credits and show up in the same ledger.
- Now the data is actionable. Credit Analytics shows the full usage picture, and you can export to a PDF or CSV, or check and purchase more credits programmatically via API.
What your credits buy
Everything in Scanifly Design Services draws from the same bank and is now visible and manageable in one unified analytics dashboard.
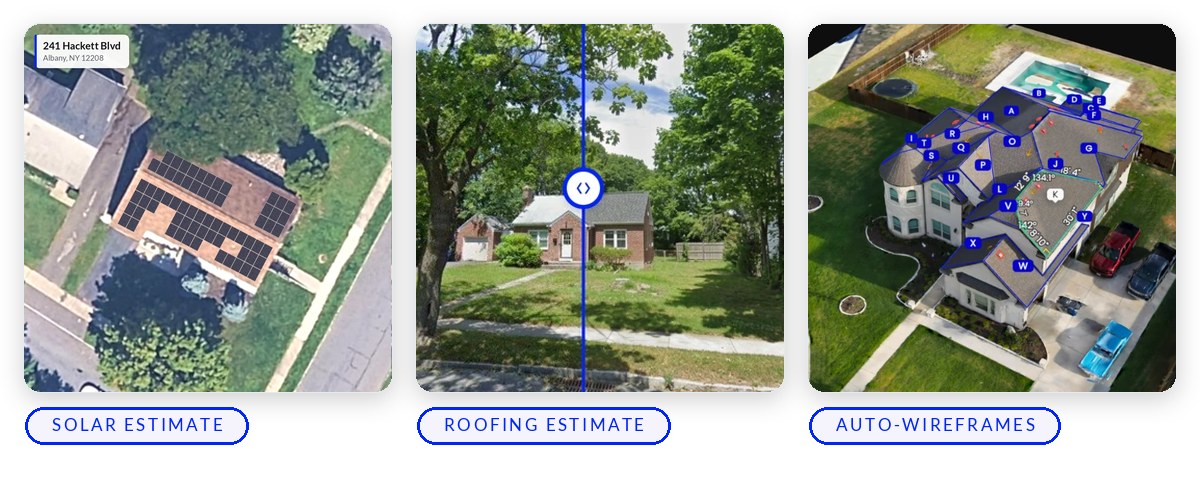
Nearmap imagery. High-resolution aerial imagery for remote designs.
Site Modeling and Max Fills. Proposal-ready remote designs with roof surfaces and obstructions outlined, trees modeled, modules placed, and shading complete.
Wireframes. Your drone-based 3D model delivered with roof planes and obstructions outlined, ready for you to place panels.
True-Ups. Your preliminary layout aligned to the drone-based 3D model so what you sold fits on install day.
Plan Sets and Stamps. Permit-ready drawings, with electrical and structural stamps available, in under 48 hours.
Leads (coming soon!). Instant AI-generated solar and roofing estimates for just $1.
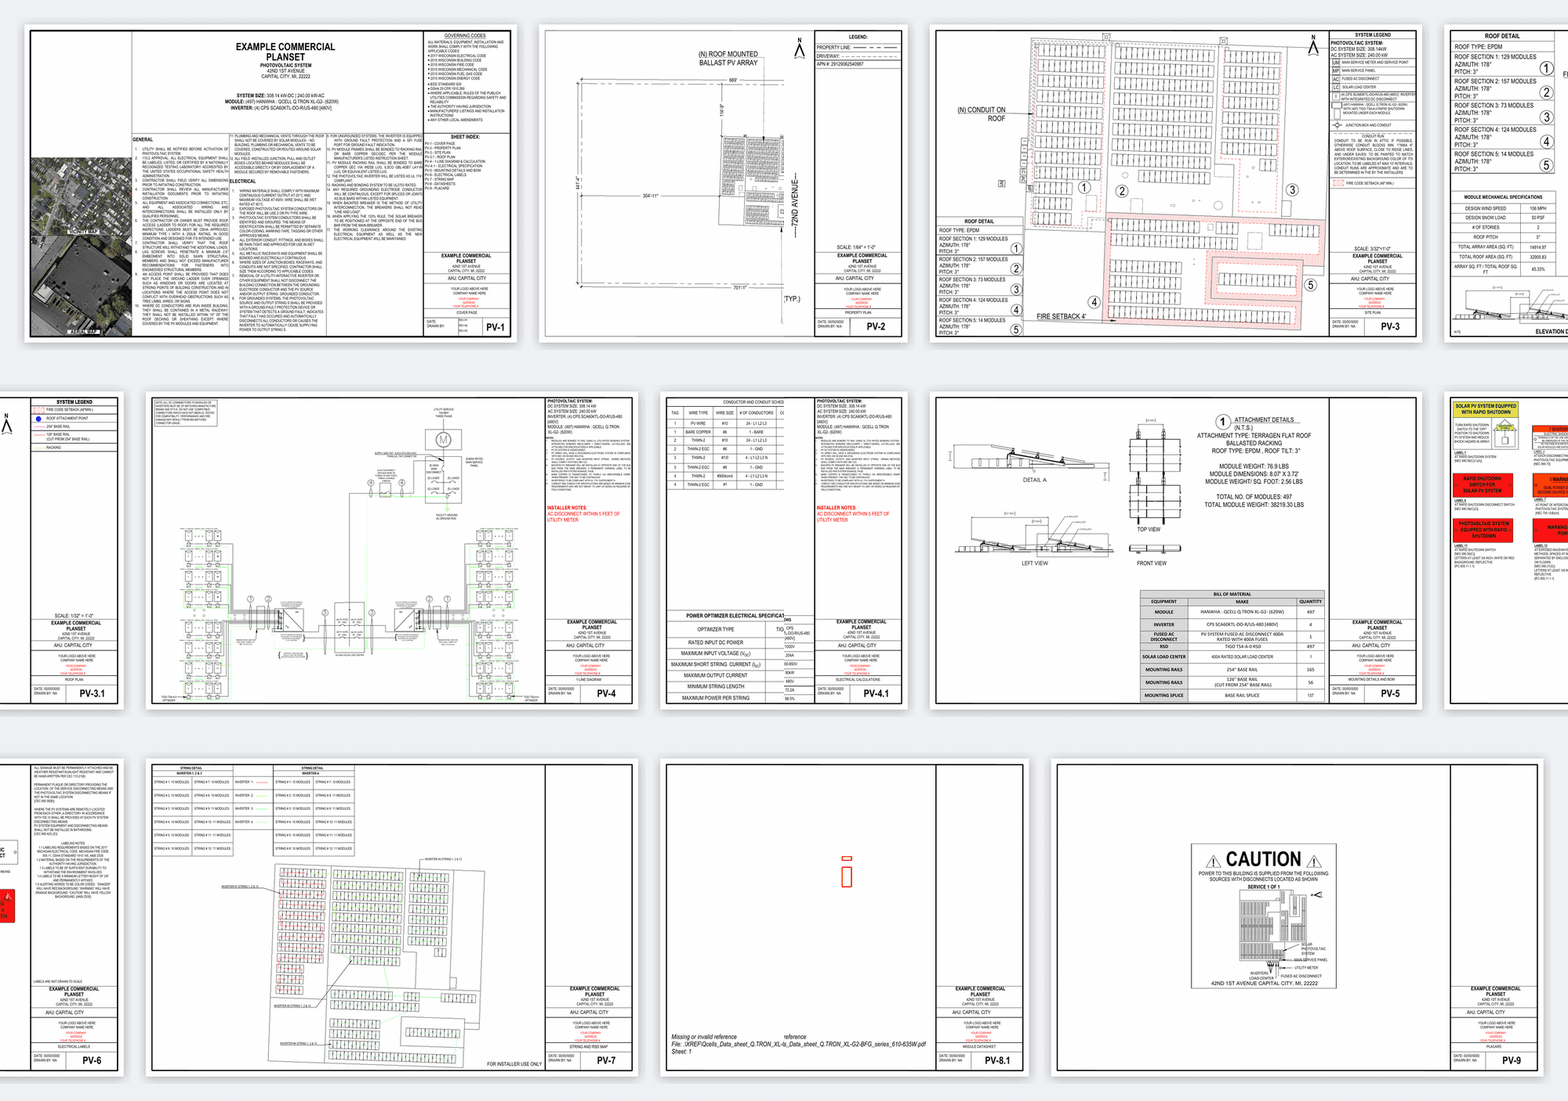
JP Novak at 512 Solar in Austin, TX described the result better than we could: “Scanifly has become a one-stop shop for us, from preliminary designs to final stamped plans.” Running the entire project workflow through one platform at scale requires transparent, easy-to-understand pricing. Read the full 512 Solar case study here.
How to use it this month
A few things admins can do with Credit Analytics right away:
- Reconcile. Set the date range to last month, export the pivot table, and match it against your books.
- Coach. Open Credits by User and look at average credits per order. A rep ordering expedited site models on every lead might be worth a conversation.
- Budget. Spend by Deliverable tells you whether next quarter’s credits are going to plan sets or wireframes, so your next purchase is an informed one.
Credit Analytics is available now to account admins. If you don’t see it, reach out to your account manager or support@scanifly.com.
Frequently Asked Questions
What are Scanifly credits used for?
Credits pay for Design Services and imagery ordered inside Scanifly: Site Modeling, Max Fills, Wireframes, True-Ups, Plan Sets, engineering stamps, and Nearmap imagery. One credit equals one dollar, and credits draw down from your account’s bank as orders are delivered. Roof reports and AI-generated solar and roofing estimates for lead generation are coming soon!
Do Scanifly credits expire?
No. Unused credits roll over when you renew your subscription.
Who can see Credit Analytics?
Account admins. Every user sees the account’s credit balance in the portal, but the full analytics view with per-user and per-project breakdowns is an admin tool.
Can I export my credit history?
Yes. Every table in Credit Analytics has a CSV export, and the dashboard has a PDF export. Exports respect whatever filters and date range you have applied. You can also view credit data and purchase more credits programmatically via Scanifly’s API.