


Accuracy
in Solar
Does Solar Have An Accuracy Problem?
Don’t waste time anymore dealing with revisions, change orders, as-builts or faulty production estimates.
Despite near-term macro headwinds, the solar industry continues to grow at an encouraging pace. Yet its value chain needs to evolve. An analysis of the solar development process — from preliminary design to installation and maintenance — reveals a considerable amount of wasted time.
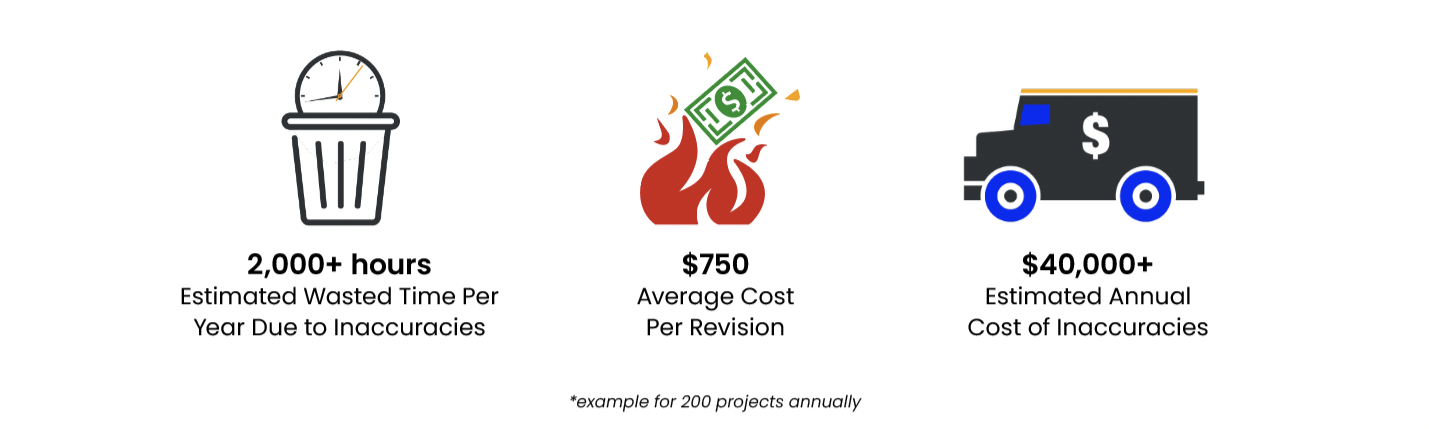
A deeper dive found that many delays were rooted in a single thing: inaccuracy. For example, 86% of Surveyors admit that their biggest challenge is collecting comprehensive field data; two-thirds of Designers report having to redo at least a quarter of their projects due to missed information. The average residential revision wastes up to 10 hours and costs a team approximately $750. With that in mind, a typical team doing 200 projects per year could waste nearly 2,000 hours and spend an additional $40,000 or more annually, stemming entirely from inaccuracy.
Inaccuracy also is damaging to project owners: the delta between forecasted production and actual production is 8% less on average since 2015. Not coincidentally, this is when solar contractors began leveraging lower-quality remote imagery as the foundation for their engineering documents.

While it’s tempting to blame certain individuals, inaccuracy is a systemic issue. It starts during the sales process with pressure to “max-fill” while using imperfect remote imagery. From there, Surveyors face safety and roof access issues yet, are asked to work quickly. Flawed survey approaches means Designers are frequently left with inconclusive information, pushing them to guess layout details. This sends ambiguities downstream to Installers to figure out system layouts on the fly.
The solar industry doesn’t need to accept this inferior workflow anymore. New technologies exist to provide solutions that improve speed, quality, and safety for all parties involved. This is where Scanifly’s solar-specific software platform comes in. Surveyors use drones and a mobile app to collect information, which allows them to be up to 5x more efficient while eliminating wasted time on the roof. Designers leverage photogrammetry, photorealistic 3D models and CAD integrations to reduce design time by over 50% and avoid any revisions.
This ebook reveals the causes of inaccuracy, how inaccurate data wastes time, and a solution for solar contractors to level up their survey and design workflows, while keeping their teams safe..
The Data Reveals Solar’s Accuracy Problem
Scanifly polled the solar industry for three consecutive years (2021-2023) to better understand Contractors’ development workflows. Currently, design revisions are common in the industry. Two-thirds (66.4%) of Contractors revise at least 25% or more of their projects, with almost one-tenth revising every single project.
Getting more accurate data is the single biggest factor within a Contractor’s control that can save time.
The leading causes of delays are electrical and structural data errors, design errors, and incomplete manual surveys.
The following are the causes of inaccuracy during key stages during the solar value chain:

Surveying
Nearly all (98%) Contractors conduct an on-site survey prior to installation. However, the majority climb on a roof and measure by hand. Surveyors are under immense pressure to complete surveys quickly. Given a dual pressure of access and speed, it’s no wonder that many take shortcuts in an attempt to save time. In fact, just one-third of Surveyors either never or only sometimes open the electrical panel, and 21% never map out conduit runs, both of which are characteristics of a comprehensive survey.


On top of that, over half of Surveyors (59.6%) don’t feel safe on roofs and more than one-third (38.4%) either never or only occasionally go on the roof, citing safety reasons.
Unfortunately, inaccuracies or incomplete data collection from a survey creates errors that impact subsequent project steps, notably the design process.

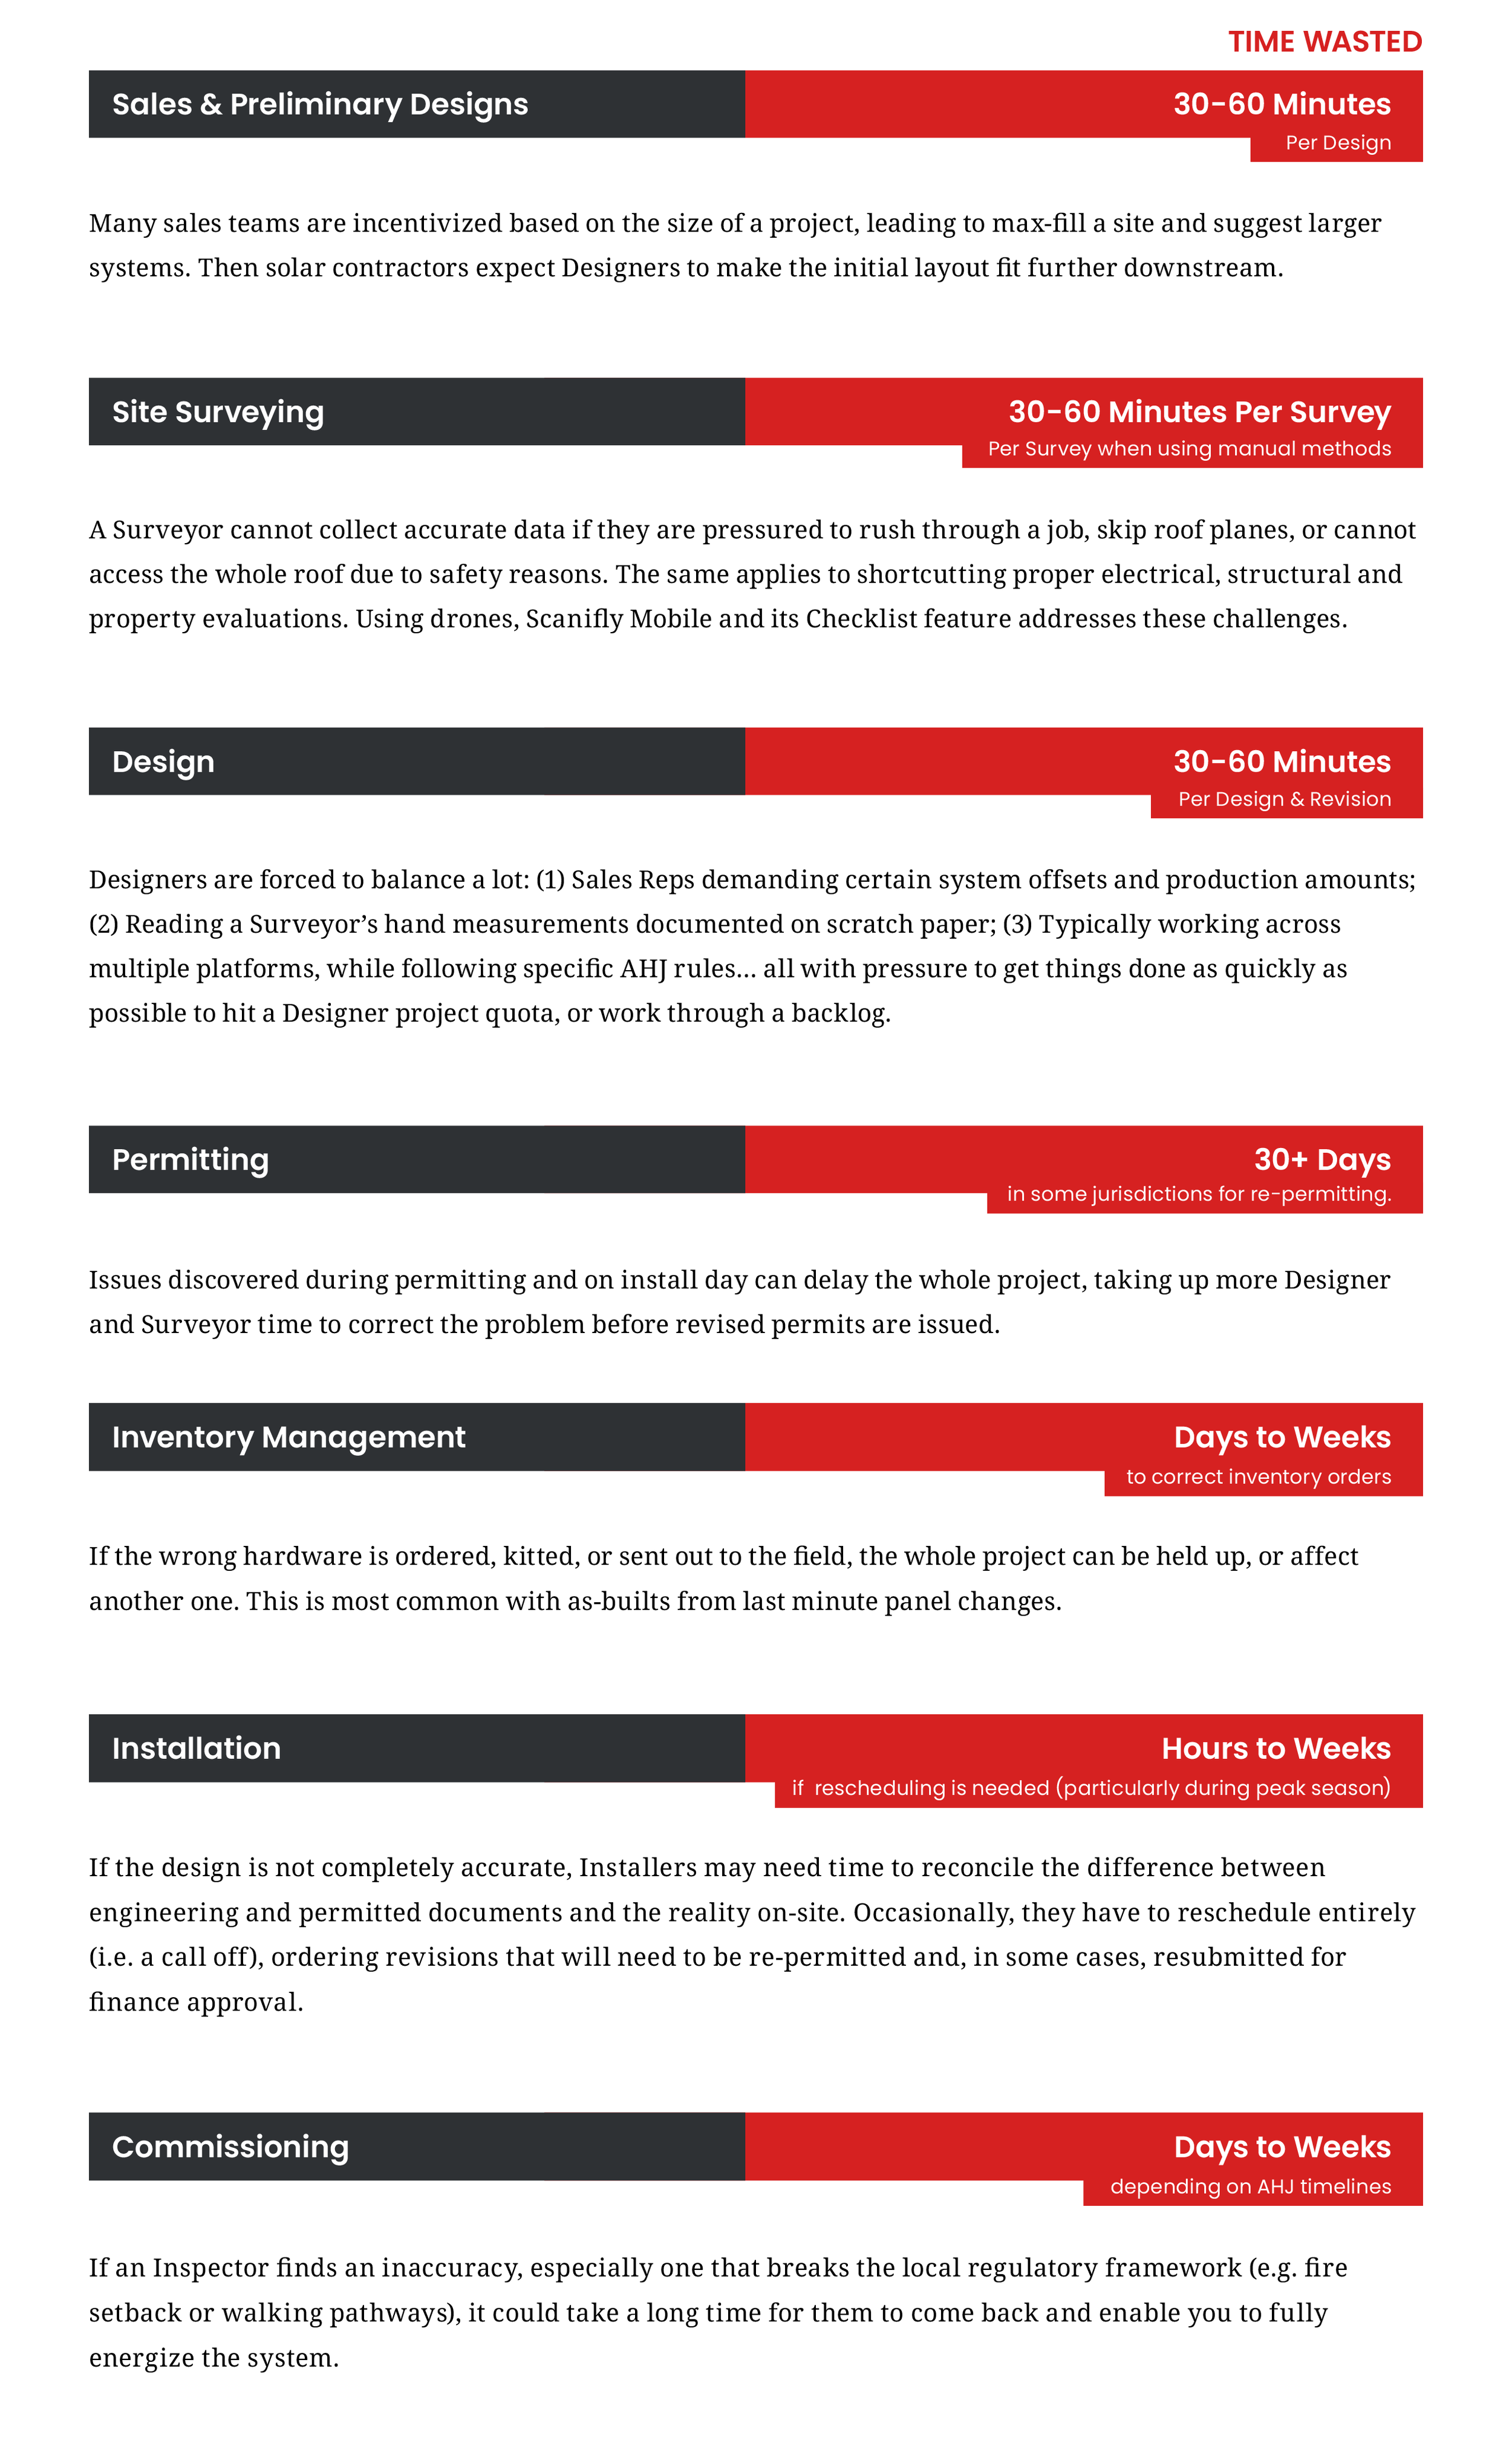
Designers have to spend significant time adjusting preliminary designs and reviewing survey data into a final design and engineering document — the majority (61.5%) spend between 30-60 minutes per design.
Design
On top of editing preliminary designs, inaccurate shading data can cause significant problems. Scanifly data found that 30% of sites had a 10%+ discrepancy between satellite data and on-site data. If a Contractor only used remote imagery it would seriously impact production, performance, and the financial viability of a project. This can become an even bigger issue for Contractors who offer production guarantees.

Incomplete survey data leads to time wasted in four distinct ways.
Designers make educated guesses based on remote imagery
Contractors request more data from Surveyors, which means additional truck rolls
Authorities Having Jurisdiction (AHJs) suggest a repermitting
Project owners demand revisions if shading analysis was done incorrectly
Installation
If Designers make educated guesses and get permits based on incorrect data, it’s up to Installers to triage any issues. This often entails spending extra time adjusting racking, fitting additional panels, or simply rescheduling the installation until changes are resolved and approved.
Inaccurate data is costly. Scanifly research found inaccurate data can waste up to 10 hours per project. At approximately $18 per hour for Surveyors and upwards of $50 per hour for Designers and other team members. The average revision costs $750 per project, inclusive of installer time and extra hardware parts.
Spending the equivalent of another full-time employee’s time and salary solely to handle inaccuracies isn’t necessary anymore. Leveraging drone technology with Scanifly’s design suite can nearly eliminate the inaccuracies that lead to wasted time and money.
Inaccuracy Lives Throughout The Solar Value Chain
Most of solar’s issues are rooted in an over reliance on remote imagery and conducting manual on-site surveys quickly. It’s natural to isolate inaccuracy to a single role; however, the issues are systemic. The “garbage in, garbage out” of data quality flows from one step to the next:
HOW REMOTE IMAGERY FALLS SHORT
One of the biggest culprits of inaccuracies across the workflow stems from using remote (i.e. satellite and aerial) imagery as more than just a preliminary design. This is because remote images often vary by at least 6-12 inches from reality and are pixelated and outdated. While remote imagery is ideal as an estimate, it is not something that can (a) replace an on-site survey or (b) be the source of measurement truth for engineering documents.
Many Contractors already know this conceptually, with 91% saying they cannot fully trust satellite data (despite using it actively).
There are two notable use cases where remote imagery is overused, leading to inaccuracy and wasted time.
Scenario 1: Remote Imagery is Used Without a Site Survey
If a Contractor uses only remote imagery and doesn’t do an on-site survey, Designers will almost certainly miss rooftop obstructions, property nuances, and key electrical and structural upgrades, forcing Installers to squeeze in remaining panels. These “fitment” issues waste a ton of time.
If an on-site shade analysis is also skipped, then the production forecast will be compromised, potentially causing panels to be placed in a shaded area of the roof. A majority (67%) of Surveyors know that on-site shading data is “much better than remote data”, but don’t ultimately decide their survey protocols. In 30% of cases, inexact remote shade data lead to faulty production estimates.


Scenario 2: Remote Imagery Plus Manual Survey Verification
Another perceived solution is a quick preliminary design that is manually verified by an on-site survey. However, the same issues remain; if a Surveyor cannot adequately or safely access every part of the roof, whether due to safety or time pressures, they can’t collect comprehensive or accurate site data. This produces better results than Scenario 1, but is still very imperfect.

How To Fix Solar’s Accuracy Problem
The main problems afflicting residential and commercial solar’s accuracy are (1) manual site surveys, and (2) an over-reliance on remote imagery. How should solar professionals level up their on-site survey practices and utilize more updated, clearer imagery?
SAVE TIME BY PRIORITIZING SURVEY ACCURACY
The vast majority of the solar industry believes collecting on-site data prior to the project’s installation is a necessary step. The following on-site data is uniformly required to compensate for poor remote imagery and construct accurate engineering plans:
Document 100% of all roof and surface measurements, pitches and azimuth.
Map the X, Y and Z dimensions and locations of all obstructions, such as vent pipes, HVAC, attic fans etc.
Record overall site context, including shading from surrounding trees, other buildings and structures.
Photograph and measure all electrical systems and structural details.
Note any safety or other property-specific considerations.
Test roof health.
For an extensive overview of how to build an on-site surveying program, see Scanifly’s handbook here.
A comprehensive survey can mostly solve the accuracy problem, but it can take a long time (the average site survey takes well over 45 minutes) and have grave safety risks, which usually means data is missed. That doesn’t need to be the case any longer — there is a way to ensure perfect accuracy and save a ton of time.
The advent of cloud computing, leveraging drones and photogrammetry, which is the process of stitching together geo-tagged images by utilizing GPS coordinate data, like colors and key points, allowed for low cost ways to quickly recreate a to-scale, virtual replica of a scene. This means that — if captured correctly —everything on site will be automatically rebuilt in a computerized environment, with the exact dimensions,
tilt, azimuth, and imagery to create a solar array.

HOW DOES SCANIFLY WORK

Fly: Fly a drone on-site for approximately 10 minutes, capturing on average between 125-175 pictures (i.e. JPEGs) of the property across two concentric circles. Any drone that takes geotagged images can be used.

Capture: Utilize Scanifly Mobile to photograph, take video, and annotate all the information related to the electrical system, structural integrity, and other property and safety considerations of the site. The app automatically digitizes all site information, and can be streamlined with a templated and customizable checklist.

Design: After the on-site data (e.g. drone images and other media) is uploaded and processed to Scanifly’s cloud — a 30-minute process — a photorealistic 3D model will be published. Then PV system designers conduct a full system layout, including defining roof segments, identifying obstructions and fire setbacks, conducting an approved on-site shading analysis equivalent to the Solmetric SunEye, and placing arrays across the property. This process takes just a few minutes.

Engineer (Plan Sets & Stamping): Upon completing the system layout, export files to CAD or SketchUp. From there, Scanifly Design Services can produce an AHJ-approved full plan set, inclusive of stamps, in under 48 hours.
Scanifly’s software platform is quantitatively accurate within 2-3 inches across the X, Y, and Z axis of the to-scale, photorealistic 3D model. Drone imagery’s resolution is up to 8x greater than consumer grade satellite imagery. Anecdotally, layouts designed in Scanifly will perfectly match the final layouts completed on install day. Contractors that use Scanifly’s technology experience zero redesigns, revisions and as-builts from panel layouts.

*Image courtesy of Organ Mountain Solar & Electric
When you have a drone on-site, the data is real-time and comprehensive. Further, no one needs to climb on the roof to collect measurements, making the process of data collection significantly faster and safer.
TIME SAVINGS USING SCANIFLY


Here’s a project level comparison of how drones with Scanifly solves inaccuracy:
Note: This does not include wasted time from permitting delays on install day
SCANIFLY’S R&D PROCESS
Here’s an overview of a residential solar analysis, where we worked with a contractor to compare the hand measurements on the roof, as well as the obstruction and electrical hardware locations, to what was automatically modeled in Scanifly’s 3D environment using drone and photogrammetry technologies. This exhibits Scanifly’s accuracy tolerance of 2-3 inches across the site:


WARNING: A DRONE-BASED TOP-DOWN PHOTO IS NOT ENOUGH
Drones can collect fully updated imagery becoming the single source of truth for your solar data from pre-sale all the way through installation and maintenance. In an attempt to save time, some contractors just take a single top-down picture that mimics a satellite image and creates an “updated map” of the property. While the underlying image will be more clear and recent than a satellite image, it doesn’t actually solve all the issues presented by remote imagery. Two problems arise:
Problem 1 - Top-down pictures are skewed: Whether due to wind conditions or the slant of the ground, the drone image will always have some skew to it. This is something that can’t be corrected solely with pilot skill either, as the environment or land angle is impossible to fully control. See red circles below.
Problem 2 - Top-down pictures have no verticality: A top-down photo gives you the X and Y axes, but not Z axis (i.e. height). Real solar designs benefit from the Z axis of everything on the property. That means Designers are often stuck working with a flat map, estimating pitches and scaling designs manually. This also poses an issue with shading analysis because tree heights and surrounding obstructions are estimated.

If you’re already on-site with a drone, you might as well capture information in the most comprehensive way through a point-of-interest (POI) flight path. This method will get you all the details you need in about 10-15 minutes flying just two concentric circles. It is the best way to recreate the scene, capture perfectly accurate measurements using the photogrammetry method, and not be forced to manually scale a skewed design, per the above.
In the end, with Scanifly, you have complete measurements of roof planes, identification of every obstruction and shade possibility, plus overall site context that you can use to discuss plans with homeowners.
SOLVE ACCURACY PROBLEMS WITHOUT COMPROMISING YOUR TIME
To understand the potential future for the solar industry, look no further than the specific evolution of solar shading tools.
From the 1990s to the 2010s, solar shading was manual and required handheld tools like a Pathfinder or Solmetric SunEye. These tools are accurate but very time-consuming, cumbersome, and dangerous to use because you needed to climb on roofs.
Then came the fungibility of satellite and aerial images of the 2010s. These once-novel technologies allowed the industry to move faster.
However, the images were grainy, often missed obstructions, outdated, and were prone to incorrect tree height estimates. .

*Image courtesy of Northwest Electric & Solar
Now, we’re seeing the pendulum swing again — this time, the industry wants to optimize both accuracy and time. Improvements to drones, mobile phones, photogrammetry and computer vision technology are becoming more commonplace.
This progression mirrors the broader solar industry’s trends: in the 1990s and early 2000s work was accurate but highly manual. In the 2010s, an aggressive sales culture took hold that focused on speed at the expense of quality. Now in the 2020s, we need to swing back to quality again without sacrificing speed.
Ultimately, we cannot meet the demand for solar–whether financial or environmental–without more people prioritizing accuracy. As industry leaders working to bring more people into solar, we can gain an immediate capacity bump with the time saved by improving accuracy. That lets Contractors do more projects, the right way, to take solar to new heights.