Planning for rooftop solar requires real-time, high-quality imagery.
Satellite or aerial imagery is common and works for preliminary designs, but the true gold standard is an orthomoasic map created with onsite drone images. It’s important to note this doesn’t mean you can take a top-down photo, get an orthomosaic map, and be done with it; it’s nearly impossible to get the quality you need with a top-down photo because you have to account for height, skew and other context on the property, not just object placement.
This article explains what an orthomosaic map actually is, how drone photography is used to create it, and why it’s superior even compared to a fully up-to-date satellite image.
What is an orthomosaic map?
An orthomosaic map is a detailed and accurate aerial or satellite image of the Earth’s surface that has been geometrically corrected to remove any distortions and create a uniform scale throughout the image.
How are orthomoasic maps created for solar projects?
Orthomosaic maps are created through a process called photogrammetry, which is the concept of using photography and other imaging techniques to extract accurate and precise measurements of objects and surfaces.
Here’s what that looks like for a solar survey:
-
The first step is collecting a series of overlapping photos. When you go to a project site with a drone, it will take anywhere from 50-200 photos in rapid succession to capture every inch of the property.
-
These pictures are then automatically overlaid on top of one another in software such as Scanifly.
-
Key points onsite, coloring, and georeferencing the objects in each image are used to stitch together a single map that covers all site context.
-
Then the map is orthorectified, which is a digital process where all skew is removed so that the image measurements are as accurate as the reality onsite.
-
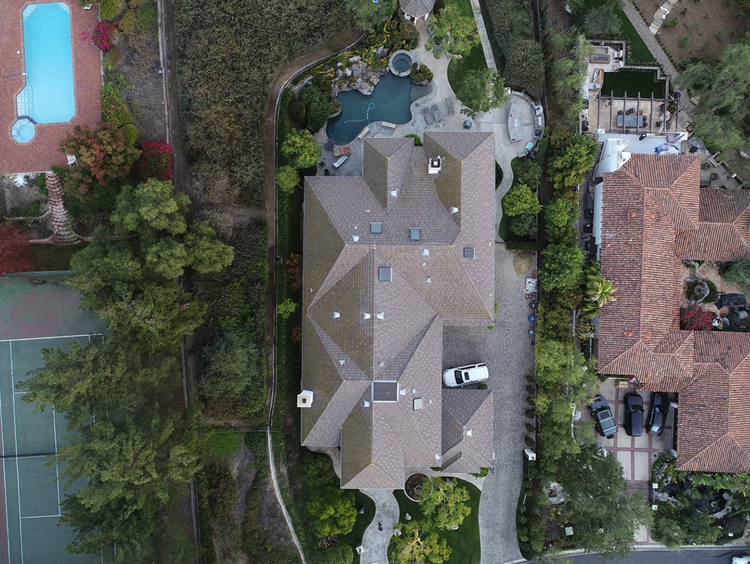
The final output is a 3-dimensional, contextual, photorealistic map of the site.
Wait, what’s wrong with satellite imagery?
A common question for people learning about orthomosaic maps is why they can’t just use satellite images.
Satellite imagery is helpful for preliminary designs because it provides a quick (and inexpensive) way to visualize an array, but it shouldn’t inform full designs for a few reasons:

-
Measurements are skewed: Satellite imagery doesn’t fully capture every slight angle or change in the ground because it is solely top-down. As a result, there is a slight skew in every image. This can lead to incorrect production estimates that can anger homeowners or cause you financial headaches if you offer production guarantees.
-
Missed roof obstructions: Satellite imagery–even high-resolution—often misses common roof obstructions that can impact array placement and shading implications.
-
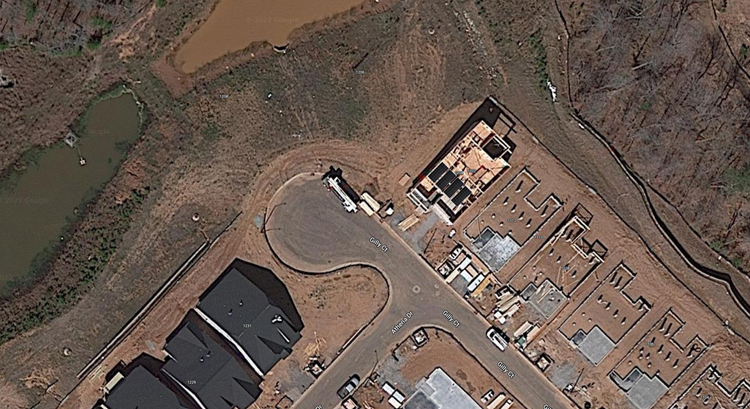
Useless for new construction: Even “updated” satellite imagery can be six months to over a year old. That means new construction images will miss significant context.
-
Risk of incorrect shade estimation: Because satellite imagery is typically grainy, and skewed, it will often miss details that impact shading whether that’s a growing tree, new construction nearby, roof obstruction, or something else.
Orthomosaic maps mean more accurate solar array designs
When you use satellite or preliminary sketches for solar designs, you risk errors in system size or placement, production estimates, and hardware costs. A better option is to create an orthomosaic map by taking x, y, and z-axis photos with a drone—not only is it accurate and efficient, but it’s in a format Designers can use more easily.
That said, if given the choice, the optimal data set is a drone-based 3D model generated using photogrammetry. This gives you the accuracy benefits of an orthomosaic over other aerial imagery, and the complete site context for accurate shading, production and more granular obstruction detection. Furthermore, if you’re already generating an “ortho”, why not get the ideal output and design in a photorealistic, to-scale 3D environment?